
Get Help with Statistical Treatment of Data in Research From Our Company
How to Write Statistical Treatment
When presenting the results of the statistical treatment of data, key areas to include are:
(1). Type of Data
Illustrate the type of data that was collected to justify the method of statistical treatment used. In statistics, data is categorized into two main classifications, qualitative and quantitative, which are further divided into: 1.) Nominal 2.) Ordinal 3.) Interval 4.) Ratio. Nominal and ordinal are qualitative categories of qualitative while the interval and ratio are quantitative data.
(a). Nominal Data
Nominal data is used for naming and labeling variables without any quantitative value. Researchers classify their observations into two or more categories that do not follow a specific order. Typical examples include education level (undergraduate, doctorate, postgraduate), disciplines of research (Biology, Psychology, Engineering), and research methods (qualitative, quantitative, mixed methods).
(b). Ordinal Data
Ordinal data comprises categories that can be arranged in a rank. The distance between each classification cannot be calculated but the classes can be ranked above and below the other. A typical example is the degree of agreement to disagreement. The responses are coded as numbers that symbolize a hierarchical order but do not reflect the real distance between the answers.
(c). Interval Data
Interval data is numerical, measured on a continuous scale, and has no true zero point. Arithmetic operations such as multiplication and division are not applicable in interval data. Typical examples include IQ scores, personality, and aptitude test results.
(d). Ratio Data
Ratio data has the presence of zero as a starting point, has the most information about the values, and all four arithmetic operations (addition, subtraction, division, multiplication) can be performed on it. Since ratio data has a starting point of zero, values less than zero are not possible. Typical examples include per capita income, return on investment, and the concentration of a solution in an experiment.
(2). Methods of Statistical Treatment
Specify the research design used and methods of data collection employed. In quantitative research, these include descriptive, correlational, experimental, and quasi-experimental, each categorized depending on the data collected. Describe the statistical treatment methods used and a justification for selecting the procedure. Illustrate how the assumptions for statistical tests were checked. An example is Levene’s test, which tests for the homogeneity of variance, Q-Q plots to test for normality or skewness, and Kurtosis to test for normal distribution.
(3). Statistical Analysis Software
Statistical analysis software allows the researcher to avoid mistakes and produce accurate figures in research if data is input correctly. Common statistical software packages include Statistical Package of Social Sciencers (SPSS), Statistical Analysis System (SAS), MINITAB, STATA, R, MATLAB, and Microsoft Excel. List any statistical analysis software packages used for analysis in the study.
Statistical Treatment of Data in Research Example
A researcher wanted to do a statistical analysis of two marketing research methods to test their effectiveness. They collected data based on two methods: interviews and focus groups. The data was collected from two groups of people in different countries using stratified sampling, measuring for variables like customer turnover rate and sales. They described the data using descriptive statistics and compared the means using t-tests. The researcher got a difference of p<0.5, showing that advertising made an impact on company sales. They then did statistical analysis using SPSS and analyzed the results.
Get Help with Statistical Treatment of Data in Research From Our Company
- Our research experts have extensive experience dealing with statistical analysis experiments and thus will deliver high-quality, accurate, and reliable results for decision-making.
- Our data treatment experts offer customized services in the statistical treatment of data for any field of research. We offer a tailored approach according to your research needs.
- Our experts use advanced statistical analysis software such as SPSS and ANOVA, ensuring that the results are precise and accurate, enabling you to make evidence-based decisions rather than relying on assumptions.
- Our services are efficient because we can deal with large data sets and can do complicated analysis processes, saving you the time that could have been used to carry out these processes.
Summary
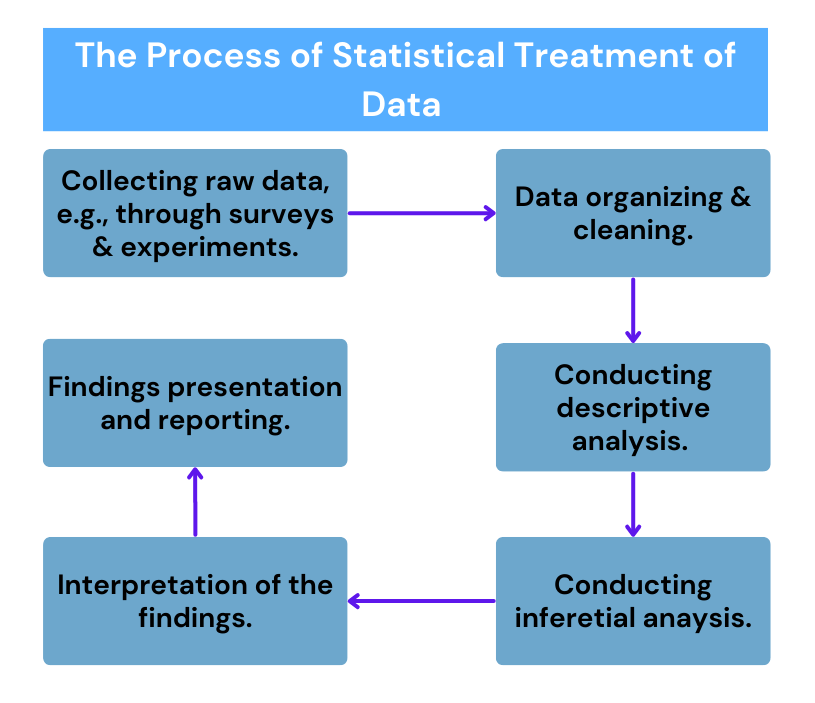
Statistical treatment of data is the use of statistical methods to turn a set of raw data into meaningful conclusions. The purpose of doing the statistical treatment is to come up with accurate, evidence-based results that are great for decision-making. Various methods can be used to do statistical treatment of data such as descriptive statistics, inferential statistics, and hypothesis testing. These processes require you, as the researcher, to have technical knowledge of the procedures.