How to Plot MATLAB Graph with different colors, markers, and line specifier?
How to change Colour, Marker, and Line-Specification in MATLAB plot?
Let’s take these two mathematical equations to plot the MATLAB graph.
1)  y(x)=sin(2x)

2) derivative of the same function d/dx(sin(2x)) on the same graph.
Solution:
The first mathematical equation is trigonometric.
y1`= sin (2x)
And it’s derivative of a mathematical equation of y(x) is
y2= d/dx (y1)= 2 cos (2x)
MATLAB code:
Here is MATLAB code you can write to plot the graph for the function of f(x) and its d/dx (f(x)).
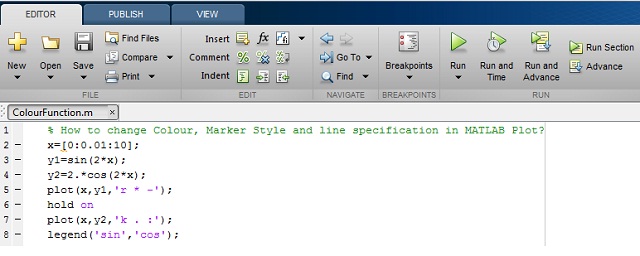
MATLAB PLot Colors code you can copy paste:
x=[0:0.01:10];
y1 = sin(2*x);
y2=2.*cos(2.x);
plot(x,y1,'r * -');
hold on
plot(x,y2,'k . :');
legend('sin', 'cos');
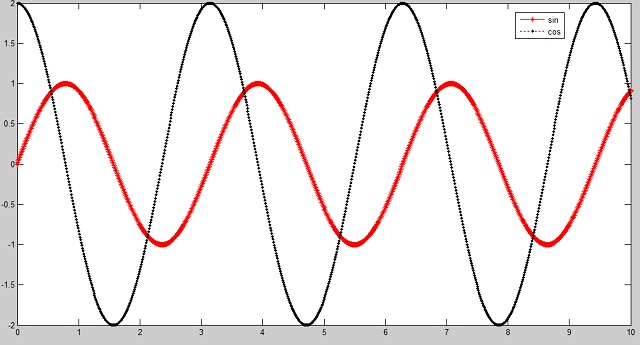
In this program, I have used the ‘legend’ function to label data series plotted on a graph. You can see in the below MATLAB output.
We are using different colors, markers and line specifications for plotting two different graphs.
MATLAB Output: